I was recently involved in a RFP for an Internet of Things (IoT) project therefore I got new interest in the domain of connected devices. I wanted definitely to know much more about it. Then Someone told me how Arduino or Raspberry Pi can be a good starting point for exploring the IoT world.
I decided to buy an Arduino Starter pack, built my first projects with LED’s, servo motor. I had fun and it came into my mind : What if I could build my own home weather station and even more what if I could visualize the results with Qlik Sense. So let’s discover how I made it…
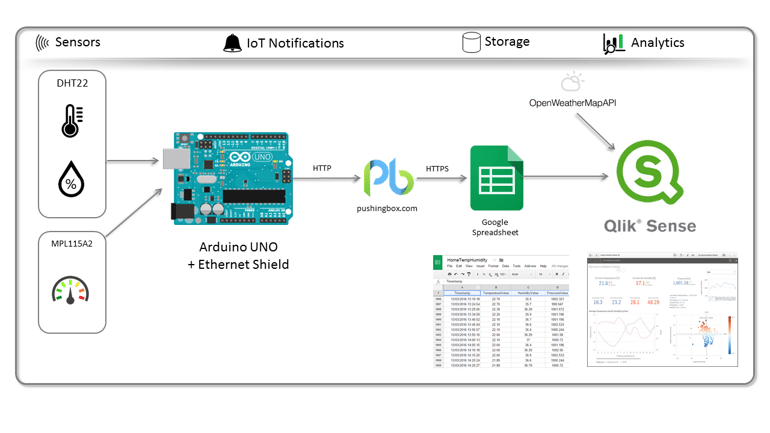
Step 1 – Assembling the Components
What you need is an Arduino Board (mine is a UNO), an compatible Ethernet shield , a breadboard and some sensors : DHT22 for measuring Temperature and Air Humidity and BMP180 or MPL115A2 to capture the air pressure. I won’t go into the details how to connection all those things together, you can find a lot of schema just googling the sensor types but It should looks like this :
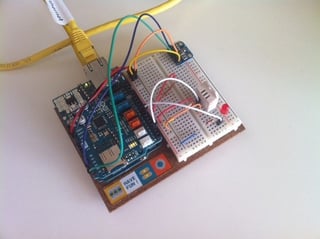
Step 2 – Collecting the data.
Download and install the ad hoc sensor libraries for your sensors and built the Arduino Sketch(.ino) to collect the measure. You’ll need also to write in the sketch the elementary things to setup a Ethernet connection enabled through the shield.
Step 3 – Sending the data on the Internet
My question is how and where to store the data on the Internet. I remember Google Docs has API that allows you to interact with a spreadsheet. Then let’s build the spreadsheet. This is simple : four columns : Timestamp, Temperature, Humidity and Pressure.
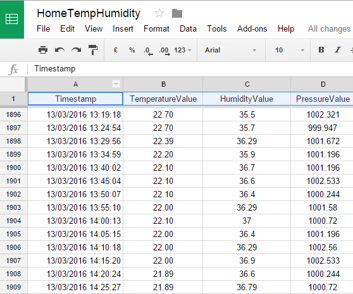
Please note the google document unique ID, that can be found inside the document url :
https://docs.google.com/spreadsheets/d/<gdoc_id>/edit#gid=0
We’ll implement a Get request query that looks like this :
https://script.google.com/macros/s/<gscript id>/exec?tempData=...&humData=…&pData=...
Globally,at each call, the script function will parse the JSON parameters and append a new row in the spreadsheet. The <gscript_id> is provided when publish the script as a web app.
Then comes the tricking things. Since Arduino can't handle https, we need to use Pushingbox API (uses http) to run the Google Script (uses https). You can sign in pushingbox.com with your google account. First setup a new Service and link the the google web app url :
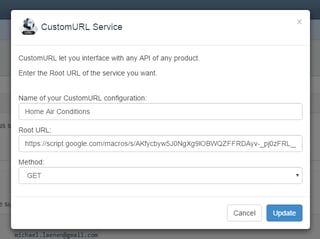
Next Add and configure the scenario.
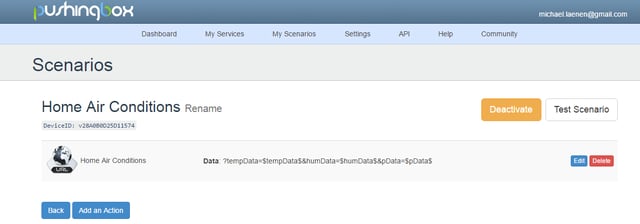
We are done with the notifications. SInce pushingbox.com allows only 1000 free notifications per day I adjus the arduino sketch to call the webservices every 5 minutes.
Step 4 – The Qlik Sense Weather App .
In Qlik Sense you can connect to a google spreadsheet with the web file connector but the url is slighty different:
https://spreadsheets.google.com/tq?tqx=out:html&tq=&key=<gdoc_id>&gid=1
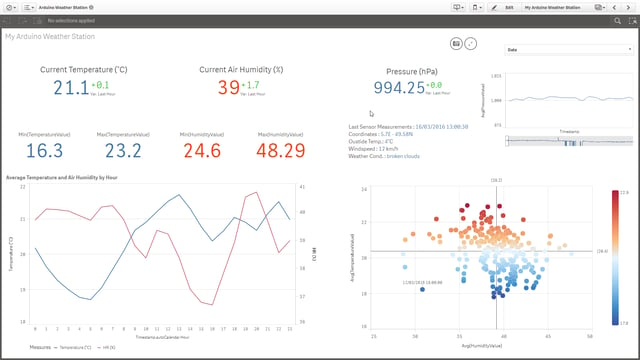
Using the Qlik Rest API connector, I also connect to the OpenWeatherMap API (http://openweathermap.org/api) to add some info from the outside weather conditions. And here is the final result :
Donwload full Arduino Sketch, Google script, and Qlik Sense App here:
See also the other posts on Agilos tech blog.


