

Trends trends trends … so what?
Top 10 tech trends for 2017. Top 5 BI trends for 2017. Etc etc. It’s that time of the year when all those industry watchers, vendors, bloggers and the like come out with their lists and predictions for the new year. It’s not that much different from those ‘5 ways to get rich’ and ’10 ways to lose weight without diet or exercise’ articles. Maybe you’ll find that the latter ones are somewhat less boring than the usual technology trends articles, but the point is (after all): what’s in it for me?
Innovation on its own is all very well, but as a company, you probably want to innovate because it brings you business value or productivity gains. And the truth is maybe your company doesn’t want to be a frontrunner, having said that, you don’t want to be a laggard either and miss out on the value of technology innovation. It’s not always easy to judge which innovations are a fad, and which ones you should be investing in.
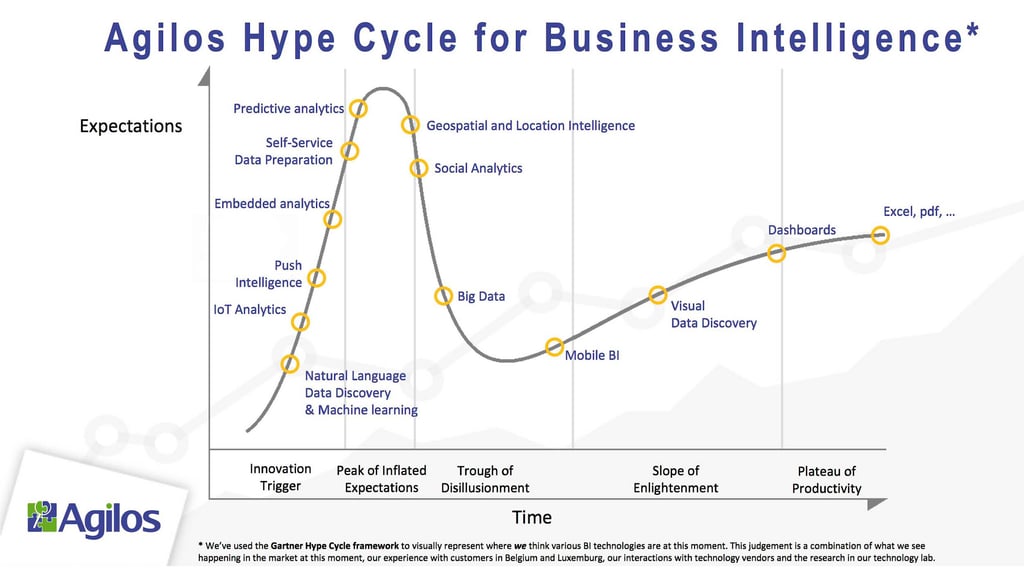
That’s why at Agilos, we decided to work on a framework that helps you put Business Intelligence (BI) innovations in perspective, and allow you to benchmark your company against all these trends.
Framework
Gartner has developed what they call the ‘Gartner Hype Cycle’, which provides a graphic representation of the maturity and adoption of emerging technologies. We’ve used this model as a framework to visually represent where we think various BI technologies are at this moment. This judgement is a combination of what we see happening in the market at the moment, our experience with customers in Belgium and Luxemburg, our interactions with technology vendors and our research in our technology lab.
To put innovation in perspective, it’s worth remembering the quote of Roy Amara, “we tend to overestimate the effect of a technology in the short run and underestimate the effect in the long run”.
So once again, it should be emphasized that this information is our judgement on where each technology is. It’s also worth pointing out that we’ve used the Gartner hype cycle as a model to graphically represent our opinion.
From right to left – from mainstream to innovative
We’ll look at various BI technologies: those on the right are the most mainstream, and then as you go further to the left, we get to see the more innovative stuff. This enables you also to judge how far you – as a company - have adopted these various BI technologies and where you are on the ‘innovation scale’. You can also use it as a way to benchmark yourself if you want to.
Excel
Excel, or I should say spreadsheets, are most likely the oldest BI tool on earth. It was used for reporting before even the term ‘Business Intelligence’ was invented, and is still today used by nearly every single business. If this is currently the main tool you use for decision making, well then we need to talk! Excel is in the first place a spreadsheet, and it’s not designed to do anything but some elementary analysis, let alone provide any serious business understanding. On the other hand, ‘Export to Excel’ is also used by countless other BI tools. But Excel as your BI tool? Really?
As you can see, Excel is as far to the right on the graph as you can get. It has reached its plateau of maturity a long time ago, and not many new innovations should be expected of it, at least from a business intelligence standpoint. Sure, there are several 3rd party extensions for Excel to give it more BI capabilities. And there’s Microsoft Power BI, which is designed to work together with Excel, although I’m not referring to Power BI as an Excel++. Microsoft certainly wouldn’t appreciate that.
I’ve put it at the same position as some other traditional (which is a nicer word for old-fashioned) technologies such as pdf. What I mean by that is this is just plain old reporting. After all, still today, many companies are distributing reports to their personnel. At best, they are offline lists used for reference purposes. But most of the time, they are not used at all … fortunately. If your company still does this, I’d advise you to do an experiment. Stop your next (daily or weekly) distribution of such reports, and see whether anyone notices.
Dashboards
Next are dashboards. We see more and more companies using dashboards, although penetration is probably only around 15% at best. But at least business dashboards are a good information management tool to visualize and track some key data points and metrics relevant to the business user. The 3 leading vendors are Microsoft, Qlik and Tableau. Others such as SAP BusinessObjects, IBM, Oracle and SAS were kicked out of the Gartner Leaders quadrant in February 2016. Read my blog on that BIG shakeout here.
Visual Data Discovery
Rather than just ‘representing’ data and metrics on a dashboard, companies can go much further to get intelligence out of their data and start ‘exploring’ rather than simply visualizing information. This is about finding relations, associations and root causes that are often hidden behind the numbers. Vendors who offer data discovery capabilities use different models to guide a business user in his exploration process. The most advanced in this category is definitely Qlik. They have trademarked their associative model and used it as the basis of their QlikView data discovery tool and their newer Qlik Sense environment. Some other vendors pretend to offer associative capabilities, but at best it’s a wrapper around their engine, while in the case of Qlik, the engine is completely built on an associative model.
We do see, however, that some Qlik users merely use their solution as just a dashboarding tool without really exploiting the full capabilities of the associative model*, so there’s room to go a step further and get more value out of your BI investment.
A couple of months ago, BARC published ‘The BI Survey 16’, the world‘s largest and most comprehensive survey of business intelligence end users, comparing 37 products in the BI space. You can download the comprehensive report with ‘The BI Survey 16’ Qlik highlights here.
Mobile BI
BI technology to gain business insights through mobile devices such as smartphones and tablets has become much more readily available over the last few years. We believe it’s important to look at Mobile BI as an extension of a broader BI platform, and this for 2 reasons. First and foremost, to minimize development and maintenance costs by choosing a technology that supports ‘build-once-deploy-everywhere’. Responsive design is essential, so the BI application adapts automatically to the device it is running on and behaves as if the application was specifically developed for that device. A second reason is that we see most Mobile BI users use their smartphone for notifications or quick KPI checking, but then switch to a desktop platform for more sophisticated analysis and discovery. In case both the mobile BI apps and the desktop or browser based BI apps run off the same underlying platform, this transition can be done in a very smooth and easy way. This should encourage the business user to use both, based on whether he’s on the road or not, or the type of analysis he wants to do.
Big Data Analytics
The popular image of Big Data tends to be data scientists running complex algorithms on huge machines. And yes sometimes big data is about people experienced in statistics and data mining. But in many cases, it’s about business users finding better, easier ways to navigate their way through the massive amounts of data to find what’s relevant to them, and get answers to their specific business questions so they can make better business decisions more quickly. For this there has been quite a bit of development done to bridge systems, such as Hadoop and Cloudera, with discovery-oriented environments now typically used by end users. Technologies including very advanced compression techniques, distributed servers and document chaining can now connect Big Data architectures with BI environments so business users can do direct discovery on truly massive datasets.
Another trend we see in this space is the data lake concept. Rather than spending tons of money or years building a well structured and clean data warehouse (which is in most cases a never ending story), a data lake stores all kinds of data (structured and non-structured) in its native form. Structure is only defined when the data is really used. More power and flexibility is given to the end user, while IT has a bigger responsibility for data governance, including data accuracy, historic data and versioning and user access rights. This end-user flexibility has become possible with the availability of self-service BI tools.
More recently, a new form of Big Data has come along … IoT. More about this when we approach the left side of the chart.
Social Media Analytics
Social Media has not only become pervasive over the last couple of years, but has also created many new opportunities for businesses. Firstly, it is now widely used as a communication mechanism, but even more importantly has become a way to analyze what people talk about, what they like (about your company or your brands) or dislike. There are dozens of social media analytics tools, but the majority of them stand on their own. We think though that the real power of social media analytics is revealed when you start combining it with information within your company (about your customers, what they buy and don’t buy, product sales and forecast information etc.). By combining social media analytics information with customer and sales data, you can start analyzing associations across these different dimensions. So look for tools you can integrate or at least connect to from within your BI environment.
Another category of external data that is gaining in popularity from a BI perspective is consumer socio-demographic information. The most well-known is Mosaic, giving you a consumer classification for your local market to better understand your customers and target audiences, their behaviors and lifestyle choices in greater detail, letting you focus your messages and sales and marketing activities.
Geospatial and Location Intelligence
Over the past few decades, location intelligence and business intelligence have been living in parallel universes. We now see these worlds coming together thereby producing much richer insights. Technologies such as GeoQlik or K4 Analytics (in case you’re using ESRI maps) enable you to easily “geo-analyze” your business data and indicators on dynamic maps integrated at the heart of your dashboard application. This technology has become mature now, and more and more organizations start to realize the power of geographical information when you combine it with structured information about your customers, sales, point of sale etc.
A great example of the power of combining (internal) customer and sales data with geographical information is Touch Point Insights, a joint development between SIRIUS Insight and Agilos. By combining Mosaic consumer socio-demographic information with customer purchase information, a company can now get a deeper insight into their market presence versus its potential. This can help them then decide where to open or close points of sale, or run marketing campaigns in areas with a low market penetration but high potential.
Predictive Analytics
Predictive analytics is reaching the peak of inflated expectations. This has long been the domain of a few specialized vendors, who offer solutions that are very difficult, time consuming and expensive to implement. But these same powerful capabilities are being packaged and integrated now within the newest generation of BI solutions. This means that your sales, forecasting and production planning dashboard can now benefit from predictive capabilities, without needing an army of data scientists. This is already possible through client-side extensions for BI tools, but over the next months and years we’ll see these extensions being integrated on the server-side of BI frameworks. Another approach is to add predictive analytic capabilities in the data preparation phase (see next paragraph). It is predictive analytics like this that will likely be the tipping point to turn BI from being reactive analytics into proactive analytics.
A recent and good example of the power of predictive analytics has been the US Presidential elections. Nearly all polls got it wrong, and predicted a victory for Hillary Clinton. There were however several predictive models based on social media analytics that correctly predicted a Trump victory.
Self-Service Data preparation
Another area that is getting talked up these days is self-service data preparation. While we see a number of BI data discovery vendors adding data preparation features to their products, there are also a number of standalone data preparation vendors currently offering easy to use solutions for data integration, data blending and data cleaning. More often than not, they add advanced analytic capabilities to the data preparation phase. One of the good examples here is Alteryx. A business user is not only able to build workflows to automate the whole data preparation process, but also add more advanced analytics such as market basket analysis. The outcome of these can then be seamlessly integrated within dashboard applications such as Qlik or Tableau.
Embedded Analytics
Gartner estimates that centrally managed and traditional publish and subscribe BI tools haven’t yet reached beyond more than 25% of the employees in a typical enterprise. In most European organizations, we even see 10% to maximum 15% penetration rate of BI tools. To go further we need to look at other ways to get analytics in the hands of knowledge workers. Business analysts might use their dashboard daily, but to reach the other users, we need to bring the analytics to them, perhaps within their business application they’re using (such as an ERP or CRM), or within their browser environment. It’s only by embedding analytics within a user’s work environment that we can reach a state of what I would call ‘Pervasive Analytics’ … so that it is used to the same extent as electricity, in other words without even thinking about it. If we can include analytics in apps or websites through mash-ups or tight integration, we can even cross company boundaries and share analytics with business partners and customers.
When Qlik started redeveloping their analytics engine a couple of years ago, they focused on providing a platform that enabled companies to develop, extend, and embed visual analytics in their apps, portals, anywhere - all done within a common governance and security framework. And in 2015 they announced the Qlik Analytics Platform, which lets you build custom embedded analytics and embed them in any enterprise application or website. The latest versions of QlikView and Qlik Sense run on this same engine.
Push Intelligence
Business intelligence dashboards are great. However, not everyone has the available time to look at all the different types of dashboards you have access to, let alone spend time analyzing them and adapting elements where necessary. Besides, when things are going according to plan, it is not necessary to look at every bit of your data every day of the week.
So how does push intelligence change the way you look at data? Well it tells you when you need to look at your data and when you should take action. When an abnormality occurs in the statistics, Push intelligence informs you about it and tells you what the possible consequences are. In this way, you don’t have to spend hours analyzing incoming data in search of what is going wrong (or going extremely well): push intelligence will let you know everything that is relevant to you. To do this, push intelligence combines and analyzes KPIs, issued from data and statistics that are distilled from your sources. This can be business intelligence software data, or data coming from other sources (CRM-, ERP-, invoicing- or marketing software, for example). A push intelligence tool picks up this data, searches for relevant changes in it and presents everything it collected within the context: it compares goals, other metrics and historical statistics. One of the more promising companies focused on Push Intelligence is Metric Insights.
IoT Analytics
One of the most hyped trends these days is the Internet of Things (IoT). The opportunities to leverage data generated by sensors is virtually unlimited. Think about predictive care, predictive asset maintenance, energy utilization analytics and so on. What do you think would be more reliable: a weather forecast that was updated 45 minutes ago or the windscreen wipers of a car transmitting signals when they are activated in real time … because it’s raining. Although only a small percentage of business users see value in IoT Analytics from a business intelligence perspective today, it is only a matter of time before this takes off in a big way.
Natural Language Data Discovery & Machine Learning
It’s still in its infancy, but machine learning is going to happen in business intelligence, most likely when vendors integrate features within existing products. It will help transition from BI as a reactive environment that helps you understand the past to a proactive environment that will help you predict the future and support you in the decision-making process. It will eventually propose recommended actions based on these decisions and outcome of actions taken in the past.
And what about the Cloud?
Simply put, we can confidently say that Cloud BI is BI delivered in a Saas model. We haven’t put Cloud BI as a separate technology in the framework, since we think that one day all deployments will move to the cloud, whether it’s a public or private cloud.
It is obvious that Cloud BI can be consumed more easily, and is easier and cheaper to deploy. However, we think that where the data resides will play an important role in the deployment process. And of course security and company policy too plays a determining role in the decision process.
When making technology choices it is important you make sure that the technology you buy has an underlying architecture that gives you a free choice of how you deploy, whether it’s on premise, in the cloud, or any hybrid solution in between.
Conclusion
Business Intelligence is one of the few technologies and processes that have been around for a few decades and that continue to be amongst the top priorities for businesses. For many companies, information has become essential to compete in today’s agile climate. It is only how this information is used and leveraged in decision making processes that has changed.
There is no doubt that dashboards on mobile devices and predictive analytics go beyond the simple reporting of 20 years ago. And whether or not your company has kept pace with this evolution depends on many factors, but at least this framework will give you a method to benchmark yourself and see how innovative your company is with regard to business intelligence. Where are you on the curve?
Footnote *) In an associative data model, users can probe all the possible associations that exist in their data, across all of their data sources. People can freely explore using simple searches and selections, asking questions in any direction without restrictions or boundaries. Unlike query-based visualization tools and traditional BI, BI tools based on the associative model do not limit users to predefined hierarchies or preconceived notions of how data should be related, allowing them to fully explore and understand how it truly is related (source: Qlik).